Warning: Undefined array key "multiauthor" in /var/www/caughtinpixels.com/public_html/wp-content/plugins/post-layout/plugin.php on line 114
Warning: Undefined array key "mobile" in /var/www/caughtinpixels.com/public_html/wp-content/plugins/post-layout/plugin.php on line 352

May the Histograms be with you!
Use the Histograms, Luke!
In this article I will cover histograms. I will use the knowledge from part I and part II of this series of articles on Understand HDR. If you missed the first two, you might want to read them too.
Some of the questions I will try to answer in this article, are ‘What is a histogram?’, ‘Why are histograms important in HDR photography?’ While answering there will be other findings; findings like: ‘Why is it important to push the histogram to the right?’
When I started on digital photography I noticed the histograms on my camera, when I played back my photos on the LCD screen. I did not really realize what, it was. I guessed it was some kind of graphical representation of the photo, which is true, but the real understanding I did not realize until much later.
Last year I attended a photo workshop, and the coach managed in a few hours, to explain to everybody, even the wives of the photo geeks, what a histogram is, how important it is and how to use it in a field. I was quite impressed by this deed.
Histograms are one of the most important tools for a digital photographer. It is always important, also if you are shooting HDR photos, some think it might not be, but it is. I still sometimes forget to check my histograms and I regret it when I get home.
What is a histogram and what does it show?
A histogram is a visual representation of how the tonal range is in a photo. The height of the bars in histogram, tells us how many pixels in the image have the specific tones.
The far left of the histogram is black and the far right is white. If there is a lot of high bars in the left hand side of the histogram, the image will have a lot of dark tones, while if there is a lot of high bars to the right, the image will have a lot of bright tones.
This photo is a well exposed photo:

A photo like this, is a well a exposed photo because the bars does not touch either side of the histogram. But it tells us more than that. From the distribution of the height of the bars, we can see that there is a peak in bright tones end of the histogram, which tells us a lot of brightness exists. And of course that is the bright clouds.
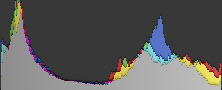
Let’s have a couple of more examples on the histograms. This is an example of a very dark image, in fact it is so dark, that the histogram has a peak at the far left: 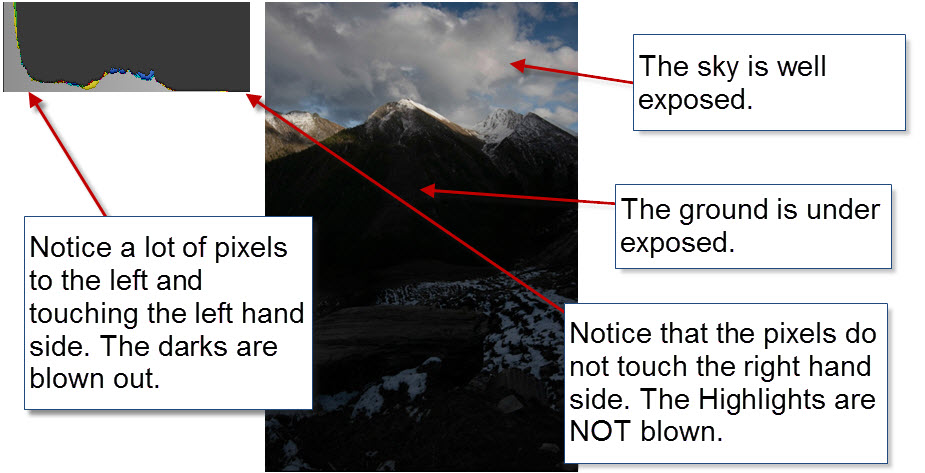 Another example of a very bright photo. Notice how there is a peak at the the right side of the histogram:
Peaks that that start rising at the ends of the histogram, tells us, that completely black (the left side) or completely white (the right side) is present in the photo. Bars that touch either side of the histogram will start clipping away information.
In the examples above, we have black clippings in the first one and white clippings in the second one. You do not want to have clippings in your photos, if you can avoid it! A clipped area has got no details at all, no matter what you do in the post-processing, there is no way that you can recover anything from these areas.
For some reason, the human eye is more forgiving to black clippings than to white clippings (with a few exceptions), so if you have a choice, choose the black clippings, rather than the white clippings.
Some say that a perfect histogram has the shape of a bell curve. But that is not true, it depends very much on the scene. Having information spread across all of the histogram is often a good thing, not evenly spread, just information all of the way. If you avoid having all of the information in one end of the histogram, you are well on the way, in particular the left side (and you will learn why, later in this article).
Dynamic range and Histograms
If you remember the ‘Dynamic Range’ we covered in part II, then this can be mapped into the histogram. In the example below 8 EVS or stops (same thing) is illustrated. A modern camera covers more dynamic range, but for the sake of simplicity I use only 8 stops in the figure.
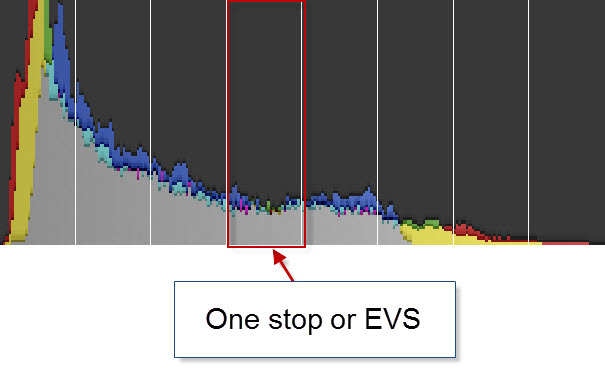
If the scene you are trying to take a photo of, has got a higher dynamic range, than your camera is capable of capturing, you can see it in the histogram. The histogram will have rising bars at each end and you need to find a way to compensate.
There are a number of ways to compensate. One way is to attach a gradient neutral filter to your lens. This you can use to darken the sky e.g. 2 stops (same as 2 EVS on the sky only). This works fine, if you are shooting landscapes with some sort of horizon.
But what if you are shooting something more complex than that? For instance if you have an object or a person in the foreground of a very bright scene? The object would become a silhouette. To compensate you can use a fill-in flash to put light on the fore ground object. This works nice and you get your histogram just right.
But what if the scene is even more complex than that? If you do not have the object within range for a flash or the scene simply is more complex? Let’s have a look at the night scene from Piccadilly Square in London: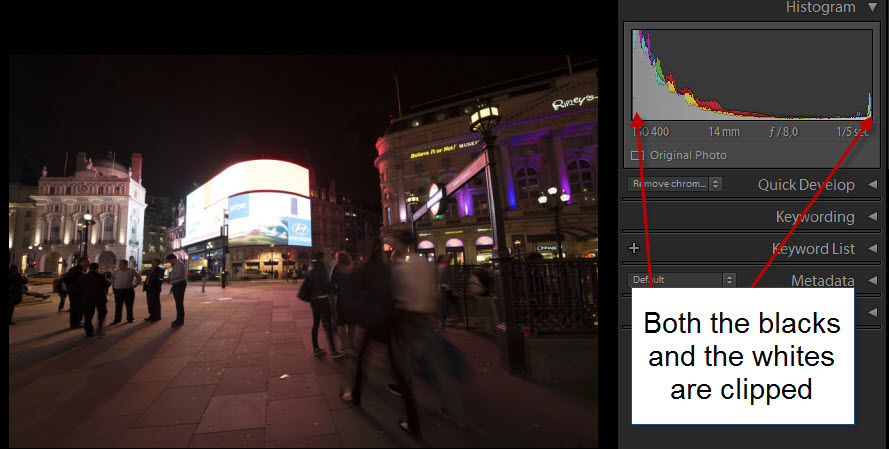 The histogram has rising peaks at both ends, and there are both black and white clippings or as some say, the highlights are blown out. This scene has got a lot of dynamic range and by shooting more shots at different exposures, the tones of the scene can be covered, from the darkest shadow to the Coca Cola commercial.
The only solution for a complex scene like this, is shooting several shots, at different exposures and with different histograms. You have covered the complete dynamic range of the scene, when you have a shot, that does not have any highlight clipping (rising peak at the right).
And the same for the shadows. When you have a shot, that does not have any black clippings. When you are certain you have both, you are done.
What you have to do, when you have shot your exposure bracketed series, it to check if histograms of the darkest and the brightest exposures, and check that there are no rising peaks at the end. If you still have rising peaks, look at the scene, and look for an explanation.
‘Is the Sun within the frame?’, then it is fine. The human eye can not look into the Sun anyway, and it is forgiving for a Sun that is blown out. The same can go for very strong light sources, like street lamps in a dark alley. But if you just didn’t cover enough dynamic range, you should a another series of photos, using a different exposure compensation.
Never trust your LCD screen – trust the histogram!
But why is it important to look at the histogram, why not just the preview using the LCD screen of the camera? Because LCD screens are not good enough to show everything. Of course it will not show you something that is not there (like a blown out cloud. That will be gone forever), but it might lead you into thinking, that you do not have a full coverage yet, and make you shoot more shots.
Use the screen for composition, but check the histograms to check, that you are OK with tonal coverage. The histogram is a very exact representation of your photo.
Push the histogram to the right – Expose To The Right (ETTR)
This is one of the most important techniques to raise the quality of the image and it has to do with, how a sensor works. CCD and CMOS sensors, that you find inside the cameras, are linear devices and they capture light in a number of bits pr pixel. My primary cameras all have 14 bits pr pixels and they all have CMOS sensors.
The first stop gives 16384 (2 to the power of 14 = 14 bits = 16384) tonal levels to capture, the second stop only gets 8192 tonal levels, and as you move down through the stops, the sensor records less and less detailed information.
In other words you get much more tonal information stored in your RAW file, if you push you histogram to the right, when you set the exposure of your photo. Without, of course, blowing the highlights.
These two histograms are a part of the same exposure bracketed series:
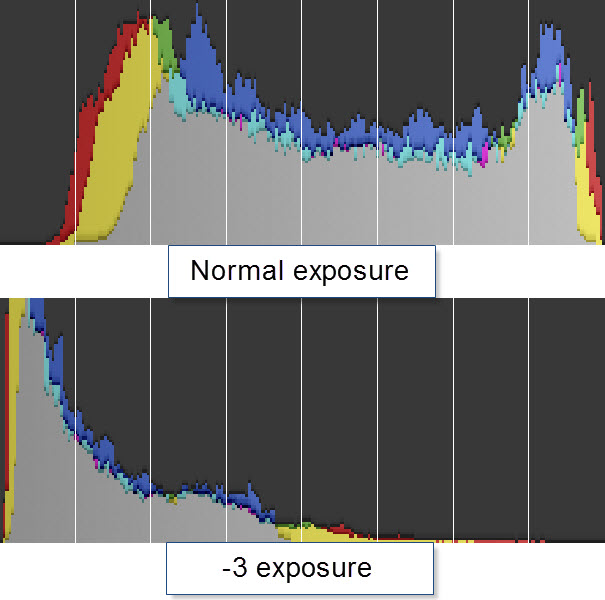
The top on is a normal exposure and the lower one is a -3 exposure. Neither of the two histograms have clippings and in that respect, both are well exposed. This tells us, that this scene was not very high dynamic (yet!). It was just before the Sun came out.
 In Lightroom I can raise the left exposure by three stops, and it will look the same as the right one:

As you can see, they are close to identical, as expected, but… The quality of the two images is not the same. Have a look at this 100% crop (click it to see an enlargement).
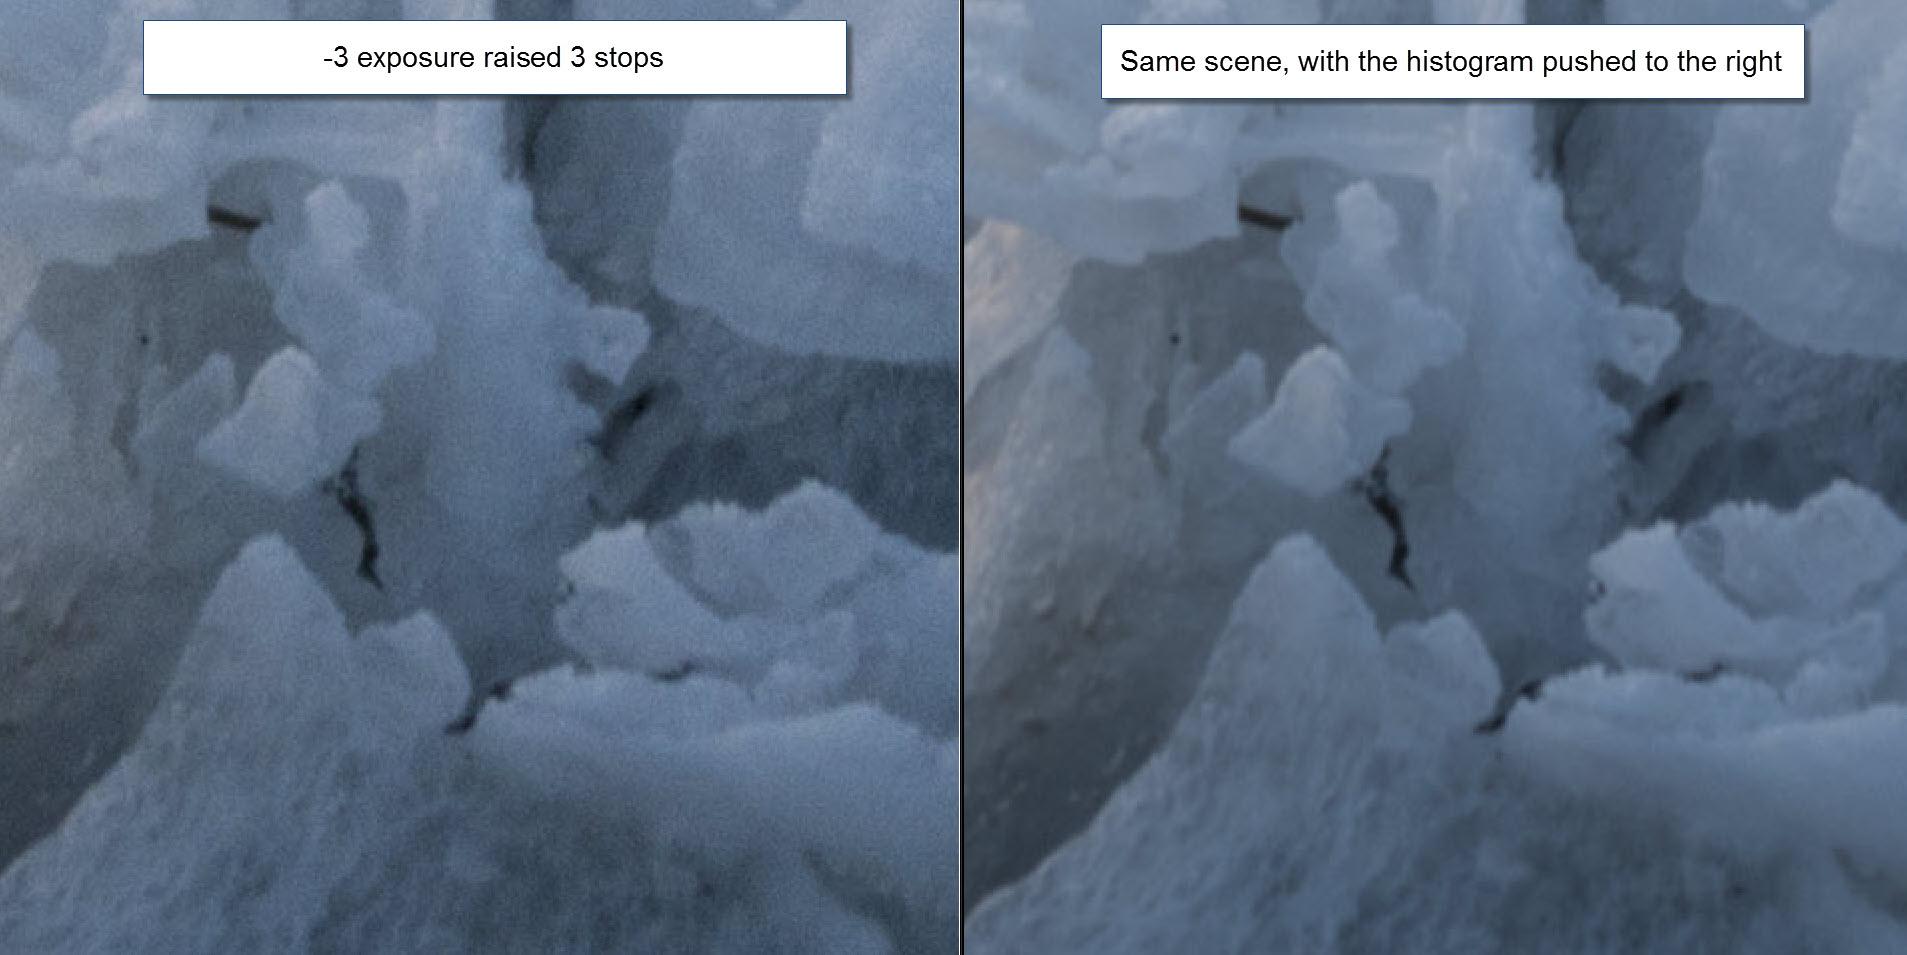
As you can see, there is a lot of noise in left one, the underexposed one. And if you can avoid that situation, you definitely want to do this.
And in this last example, I instead pushed the normal exposure to -3 in Lightroom, and as you can see, they are identical again.

How to use ‘Expose To The Right’ and High Dynamic Range
But how to use this ‘technique’ of exposing to the right together with HDR? The way you have to think of bracketing your shots, is that your histogram is spread across more photos, with different exposures. When you put your bracketed shots into your HDR software, and merge it into a final image, you will get the final histogram.
You can increase your image quality, by making sure, that your shadows, are brought well away from the edge of the left side in the histogram. Avoid having a peak at the fair left in the brightest shot, spread the peak out. Shoot a shot even brighter. The darkest tones doesn’t have to go to the left side of the histogram, just spread it out. This will increase your image quality significantly.
I have made some mistakes in the beginning when I shot my ‘city by night’ shots. The dynamic range can be incredible high in a night shot, as the Piccadilly Square above also shows. The mistake I made in the beginning, was that I was satisfied with the histogram, as soon the left side was clear. But if you still have almost all of your information in the left quarter of the histogram, you simply cannot get as good an image quality, as you can if you push the histogram further to the right.
For that reason, I often shoot from -4 to +4 when I shoot my ‘city by night’ shots. I shoot -4 to get the details of the street lamps and +4 to get the shadows pushed away from the left side.
Next article
The next article is about HDR and Tone mapping. It will build on the foundation we have built up know. Until then, remember:
Use the Histograms, Luke!
Further readings
- Understanding HDR part I – Exposure Value Steps.
- Understanding HDR part II – The Dynamic Range
- Read part IV about HDR and Tone mapping here.
- Get 15% discount on Photomatix Pro. Use promo code: caughtinpixels.
- You might also want to read my free detailed HDR tutorial here.
Warning: Undefined variable $pstl_comments_number in /var/www/caughtinpixels.com/public_html/wp-content/plugins/post-layout/plugin.php on line 43
Warning: Undefined array key "cid" in /var/www/caughtinpixels.com/public_html/wp-content/plugins/post-layout/plugin.php on line 46
Forstår ikke Engelsk 🙁 (årgang 1939)
Hans
Warning: Undefined variable $pstl_comments_number in /var/www/caughtinpixels.com/public_html/wp-content/plugins/post-layout/plugin.php on line 43
Warning: Undefined array key "cid" in /var/www/caughtinpixels.com/public_html/wp-content/plugins/post-layout/plugin.php on line 46
Hej Hans Christian,
Hvis du er frisk på det, så prøv at kopiere teksten ind i http:\\translate.google.com – den er god nok til, at du kan få mening ud af det.
Mvh
Jacob
Warning: Undefined variable $pstl_comments_number in /var/www/caughtinpixels.com/public_html/wp-content/plugins/post-layout/plugin.php on line 43
Warning: Undefined array key "cid" in /var/www/caughtinpixels.com/public_html/wp-content/plugins/post-layout/plugin.php on line 46
Nice job with these articles on HDR Jacob 🙂
Warning: Undefined variable $pstl_comments_number in /var/www/caughtinpixels.com/public_html/wp-content/plugins/post-layout/plugin.php on line 43
Warning: Undefined array key "cid" in /var/www/caughtinpixels.com/public_html/wp-content/plugins/post-layout/plugin.php on line 46
Thanks a lot Arne 🙂
–Jacob